
一个慢查询报警的简单处理 (r8笔记第12天)
公众号:杨建荣的学习笔记 · 作者:杨建荣 · 发布:2016-02-17 23:24:37 · 原文链接
今天在做节后的一个基本检查的时候,发现一个不太起眼的报警,报警内容为大体为:
MySQL 每秒慢查询次数超过 <1>个on xxxx
查看zabbix的监控数据,发现每秒竟然有10个左右的慢查询,按照这个量,这个数据库得存在多大的问题啊。
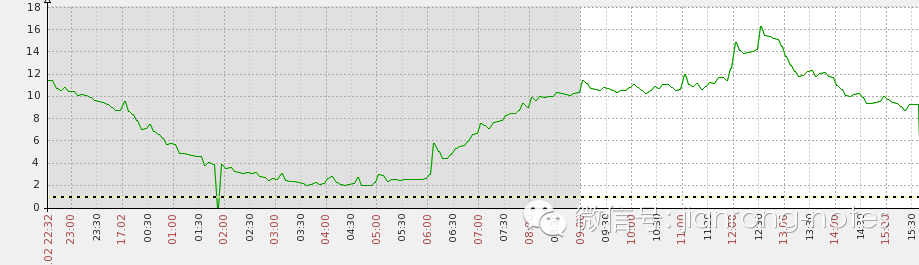
所以觉得可能是在做一个全表扫描导致的sql影响。
这个数据库算是一个核心业务,而且负载一直不高,没有收到任何关于IO,CPU,内存,swap的任何报警,一直在稳定运行,所以这是疑点之一。
这个库因为很稳定,平时就是检查基本的备份和基本的空间管理和日常的基本数据维护,而且也接手时间不长,所以很少去关注更多的内容,当我找到对应的数据目录,发现一个问题,那就是这个慢日志文件竟然有近60G
-rw-r–r– 1 root root 102M Feb 4 17:14 query.log
-rw-rw—- 1 mysql mysql 58G Feb 17 14:58 slow.log
一个慢日志如此庞大,这得暗示多大的性能问题啊,这是疑点之二。
当然如此庞大的日志文件,我看看是从什么时候积累起来的
# head -10 slow.log
# Time: 131114 13:41:59
# User@Host: app_new_bill[app_new_bill] @ xxxx_2.107 [xxxx]
# Thread_id: 131044 Schema: mobile_billing Last_errno: 0 Killed: 0
# Query_time: 0.000648 Lock_time: 0.000129 Rows_sent: 28 Rows_examined: 58 Rows_affected: 0 Rows_read: 28
# Bytes_sent: 4235 Tmp_tables: 0 Tmp_disk_tables: 0 Tmp_table_sizes: 0
# InnoDB_trx_id: 1718382
SET timestamp=1384407719;
select app0_.id as id1_, app0_.appname as appname1_, app0_.appkey as appkey1_, app0_.appsecret as appsecret1_, app0_.iplist as iplist1_, app0_.isshow as isshow1_, app0_.flag as flag1_, app0_.test_version as test8_1_, app0_.create_date as create9_1_, app0_.game_type as game10_1_, app0_.callback_url as callback11_1_, app0_.iappay_id as iappay12_1_, app0_.isactivate as isactivate1_ from test_app app0_ where app0_.isshow=1 order by app0_.create_date desc;
# Time: 131114 13:42:01
# User@Host: app_new_bill[app_new_bill] @ xxxx_2.107 [xxxx]
看来这个日志积累自2013年了,所以几年下来一直积累到了如此庞大。
当然我们需要马上使用新的日志文件,这个文件就权当备份日志吧。使用mv修改日志名,然后使用mysqladmin flush-logs 刷新日志,这样新的日志内容就写到slow.log里面了。
切换之后的情况如下:
-rw-rw—- 1 mysql mysql 16195105 Feb 17 15:54 slow.log
-rw-rw—- 1 mysql mysql 61757873052 Feb 17 15:02 slow.log.bak
目前的慢查询的配置是2秒的基线。
我们来看看慢查询日志中的sql
# InnoDB_trx_id: 1B5249A5
SET timestamp=1455695652;
select * from tb_version_update where appkey=’1400140930701′ and media_channel_id=’2014142002′ and take_effect_date < ‘2016-02-17 15:54:12’ and is_take_effect=1 and isshow=1;
# User@Host: app_sdk_hero[app_sdk_hero] @ xxxx_128.100 [xxxx]
# Thread_id: 4537955 Schema: mobile_billing Last_errno: 0 Killed: 0
# Query_time: 0.000570 Lock_time: 0.000072 Rows_sent: 0 Rows_examined: 158 Rows_affected: 0 Rows_read: 0
# Bytes_sent: 1753 Tmp_tables: 0 Tmp_disk_tables: 0 Tmp_table_sizes: 0
# InnoDB_trx_id: 1B5249A6
SET timestamp=1455695652;
select * from tb_version_update where appkey=’1400140930701′ and media_channel_id=’2010321003′ and take_effect_date < ‘2016-02-17 15:54:12’ and is_take_effect=1 and isshow=1;
可以从这个日志看出,其实这个查询的执行时间很短,肯定没有达到慢查询的触发条件,不过根据执行计划来看,确实没有走索引。
而且关键的是相关的表只有150多条记录,实在也没必要添加索引了吧,所以性能问题的可能性也不大。
这个时候有一个新的参数,也是跟同事那儿取经所得。log_queries_not_using_indexes
# mysqladmin var|grep index
| expand_fast_index_creation | OFF |
| fast_index_creation | ON |
| innodb_adaptive_hash_index | ON |
| innodb_adaptive_hash_index_partitions | 8 |
| log_queries_not_using_indexes | ON |
如果查询没有做索引,也会记录到慢查询之中,所以需要修改为off, set global log_queries_not_using_indexes =OFF即可。
然后就再也没有这类的报警记录了。
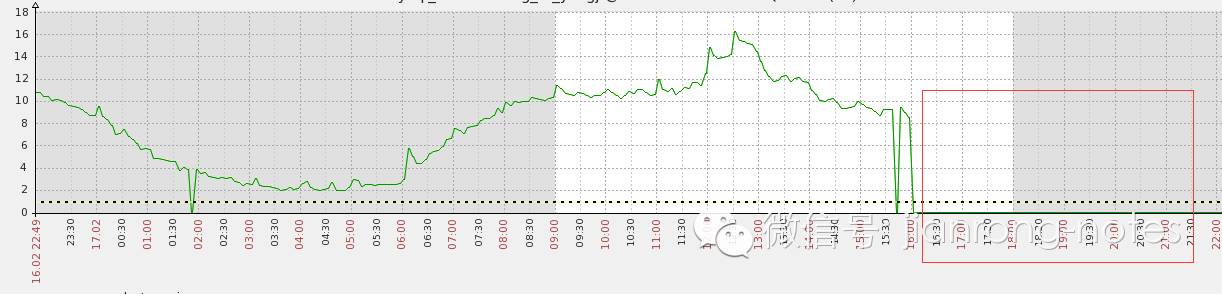
对于这个参数,默认值是off,所以一般也不会触发这个问题。
官方对于这个参数的解释如下: